JUL 12: Waving Signs

I’ve been playing around with sinewaves a bit more.
I now have a tool where I can create different images & save them by hitting a spacebar.
download: mac windows linux

An animated Gif:
animatie_patroon_klein


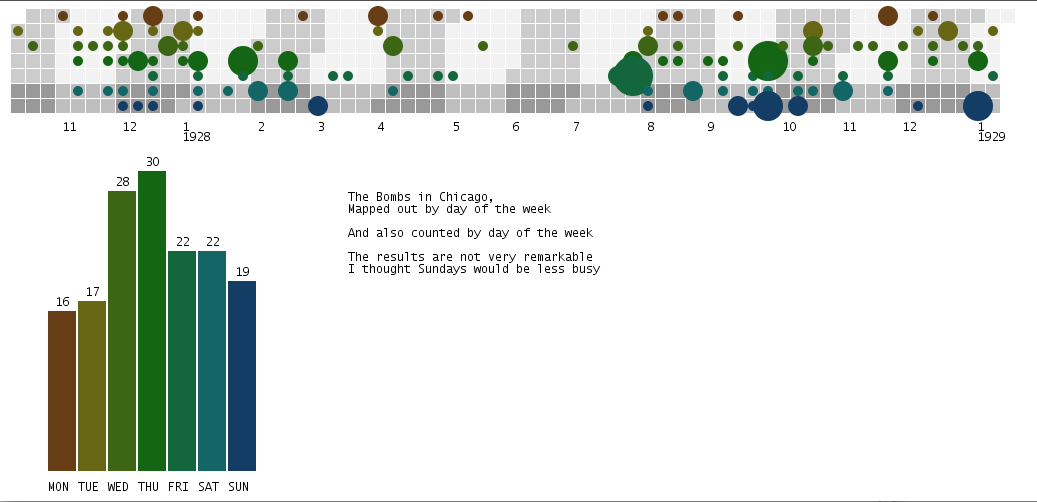
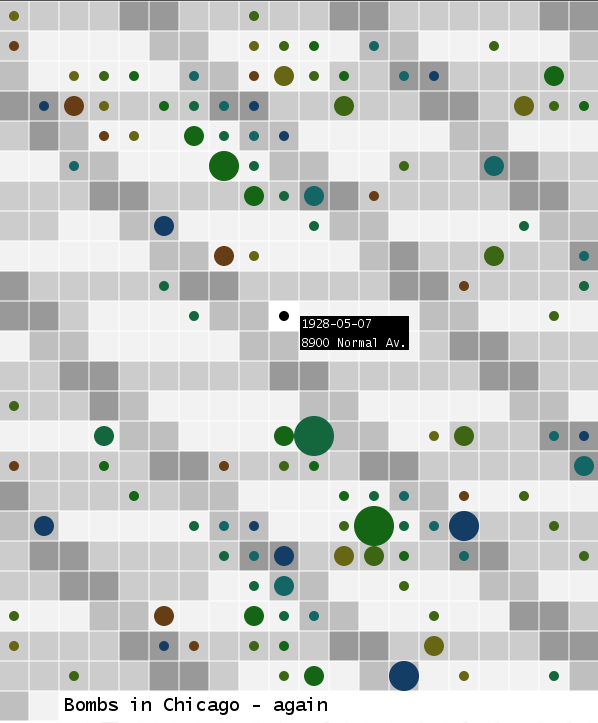
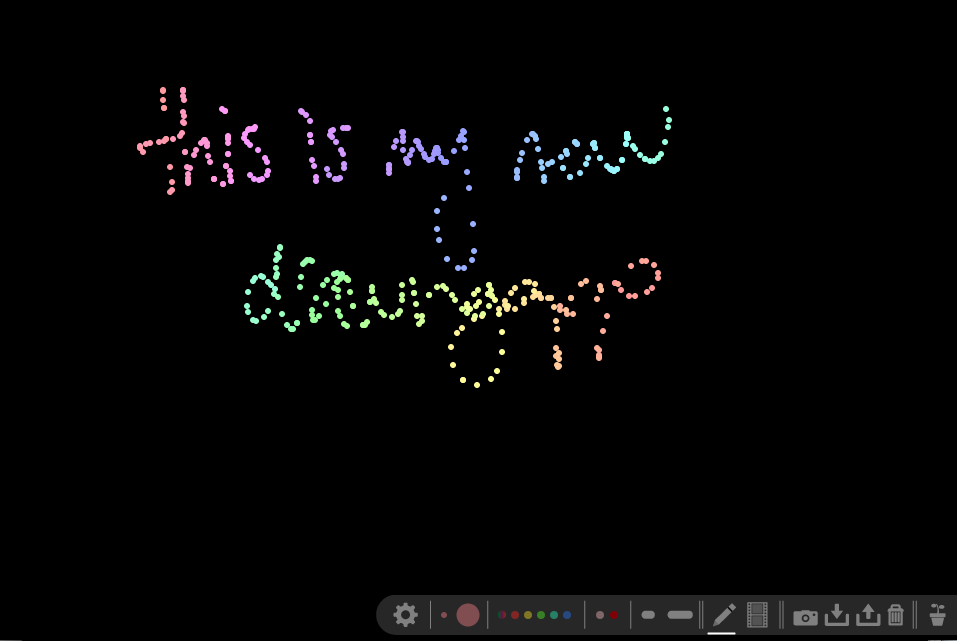
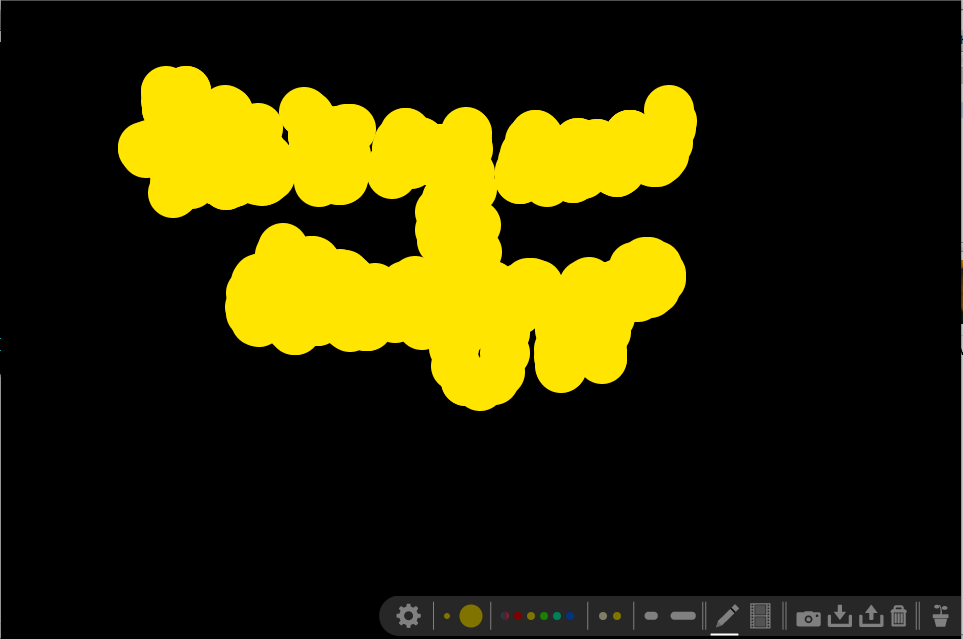
A selection of images.


// instructions (key use) for the tool:
up & down: different pattern
right/left: bigger bars
n & m: more space between bars
spacebar: take a picture
b&v: change the background color to black or white

Posted in done | Leave a comment

06.07 3D Effect / Bevel Emboss

Thanks to Sonja van Vuure, I was acquainted with the “Bevel/Emboss” effect in Illustrator, and it makes me happy.
hippebakstenen


I know that this effect is kinda old school by now.. but it’s new to me!

Posted in done | Tagged | Leave a comment

03.10 bombs revisited again

I made some updates to the Bombs

– created a calendar view
– made a list view that shows a listing of when the bombs went off, colored by month. including arcs to entries with the same business name
– made a list view that lists all bomb locations alphabetically.

Calendar View: With Amount of bombs per day
List View: By Date List View: Alphabetical

Posted in done | Leave a comment

03.10 Debate/brainstorm/teaching tool for Levien

My friend Levien asked whether I could make him a tool that he could use to brainstorm with his students about themes.  He envisioned that in this tool you could add words and rearrange them on a screen to categorize them.

I built just that, plus an extra mode to be able to arrange the words along to two axes..
Oh, and the ability to add colors, and take screenshots, and save your brainstorm, and all that.

Screen 3: organizing

Screen 3: organizing

download the processing code, and apps for windows, mac & linux


Posted in done | Tagged , | Leave a comment

03.07 bombs revisited

I’m playing around with a new Java library (Joda Time) I found that makes it a wholeloteasier to deal with dates.

I was curious to know if bombs would be more likely on some days of the week. I was expecting to find that weekends were less popular (or Sundays at least). But this appears not to be the case.

Now I’m cross referencing dates and bombs.

Unfortunately the “unfolding maps” plugin is not working anymore with processing 2.0 and up. Switching between versions is the only solution I’ve found so far..
Screen shot 2013-03-07 at 4.28.11 PM

Screen shot 2013-03-07 at 10.17.32 PM

Posted in done | Tagged | Leave a comment

02.02 Dotje

I’ve been turning a little snake drawing test that I did two weeks ago into a full-on application.
with:
– a loading screen & starting animation
– a menu where you can change the settings
– a save / save image  feature

next are:
– improved clicking (for some reason the menu opens up slow)
– a file listing, open files feature
– mouseovers or other indications on the menu (it doesn’t feedback well yet)
– get it working on android
– make an iPad app version (lofty goal)

download for Mac / Linux / Windows

Screen shot 2013-02-02 at 1.43.18 AM
Screen shot 2013-02-02 at 1.43.53 AM
Screen shot 2013-02-02 at 1.44.16 AM Screen shot 2013-02-02 at 1.43.58 AM

Posted in done | Tagged | Leave a comment

23.01 Mapping Maffia Bombs in Chicago

When I lived in Chicago I found a book  by Gordon L. Hostetter and Thomas Quinn Beesley called “It’s a Racket” in the beautiful public library. The book from 1929 describes the practice of Racketeering –
It’s a gorgous book with chapter titles that tickle the imagination: “Cabbages and Kings”, “The ‘Daddy’ of Them All”, “Under the Spreading Chestnut Tree”. The first supplement, “Business by Bombs” features a detailed list of all the bombs that exploded between October 1927 and February 1929. With the date, address, business type, and the reason for the bombing.

I did a project – showing violent Chicago’s past in the streets – about this when I was at the Art Institute.
And today I started to explore the interactive / data visualisation opportunities.

.. To be continued.

[Google Spreadsheet with all the data]

What I made so far:
Screen shot 2013-01-23 at 11.24.32 PM
IMG_9622 IMG_9623

Posted in done | Leave a comment

15.01 Mapping the Collection pt 3: Interactive, and so much better

I’ve been mapping the Boijmans Museum’s City Collection (A collection of artworks made by artists from Rotterdam, The Netherlands).
I had been stuck for a while with just counting artists, but after a good night’s sleep, I finally figured out how to show all the data in the graph, and make it interactive

So go see:
– how old was the artist when (s)he made the artwork?
– how old was the artist when the artwork was bought?
– or how old was the artwork when it was bought by the museum?
– what kind of artwork is it?

You can switch the colors to see which era the artwork was bought in, or what kind of work it is (photos, drawings, and prints are popular).

Mouseover the pixels to get the title, maker and year the artwork was made.

All of this with some pretty neat flying dots! – Enjoy.

// Update 16.01: Now available  in English for niet-Nederlanders..
// Update 18.01: Cleaned up, improved interface. Added statements, next to questions.

Download Mac / Windows / Linux

Posted in done | Leave a comment

14.01 Mapping the Collection part II

I’ve been making data visualisations of the Boijmans Museum’s city collection.

I now managed to connect two data-sets (the object’s data, and those of the artists) to find:

The ages artists are when they make their work (predominantly 25-45 years old)
And
The ages artists are when their work is acquired (also between 25-45, but with odd spikes at 32, 39, 65 and 85).

Posted in done | Leave a comment

21.12 Make your own Mozart / Wurfespiele

Than told me about Mozart’s Musikalisches Wurfelspiel.
Mozart came up with a dice game, where by throwing the dice 16 times, the player would select 16 different measures, that together make up a minuet.

“For each measure, two six-sided dice are rolled, and the sum of the dice used to look up a measure number in one of two tables (one for each half of the minuet). The measure number then locates a single measure from a collection of musical fragments. The fragments are concatenated together, and “music” results.”.

So I decided to see what it’s like if you remake it with a Tenori-On like interface. – So you get more immediate feedback than with rolling dice.

The screenshots don’t say much, you really have to play it.
The music was provided by Than / greencouch.
And it’s just a sketch – to see if I could do it, and if it’s fun to play. I’ll be updating the handling of sound, and interface later.

Download Mac / Windows / Linux

Posted in done | Tagged | Leave a comment