I’ve been mapping the Boijmans Museum’s City Collection (A collection of artworks made by artists from Rotterdam, The Netherlands).
I had been stuck for a while with just counting artists, but after a good night’s sleep, I finally figured out how to show all the data in the graph, and make it interactive
So go see:
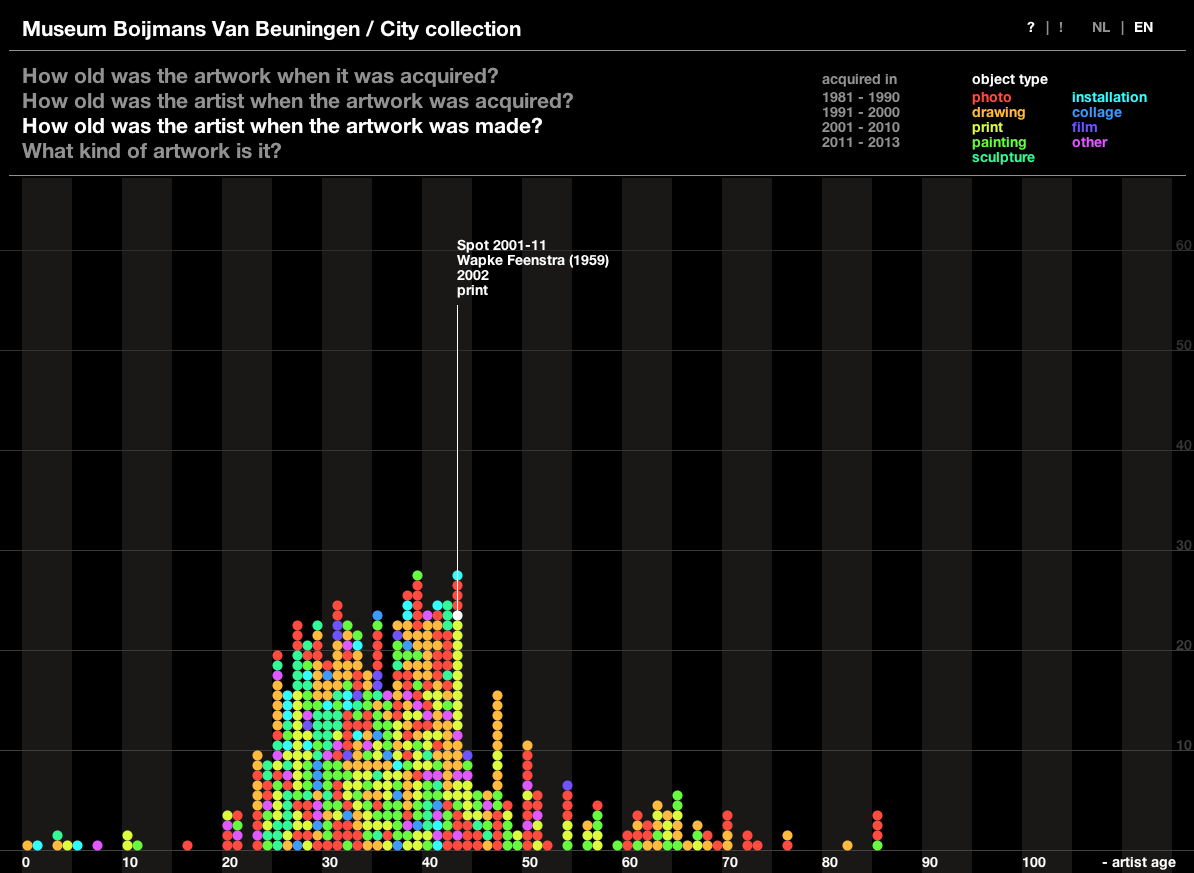
– how old was the artist when (s)he made the artwork?
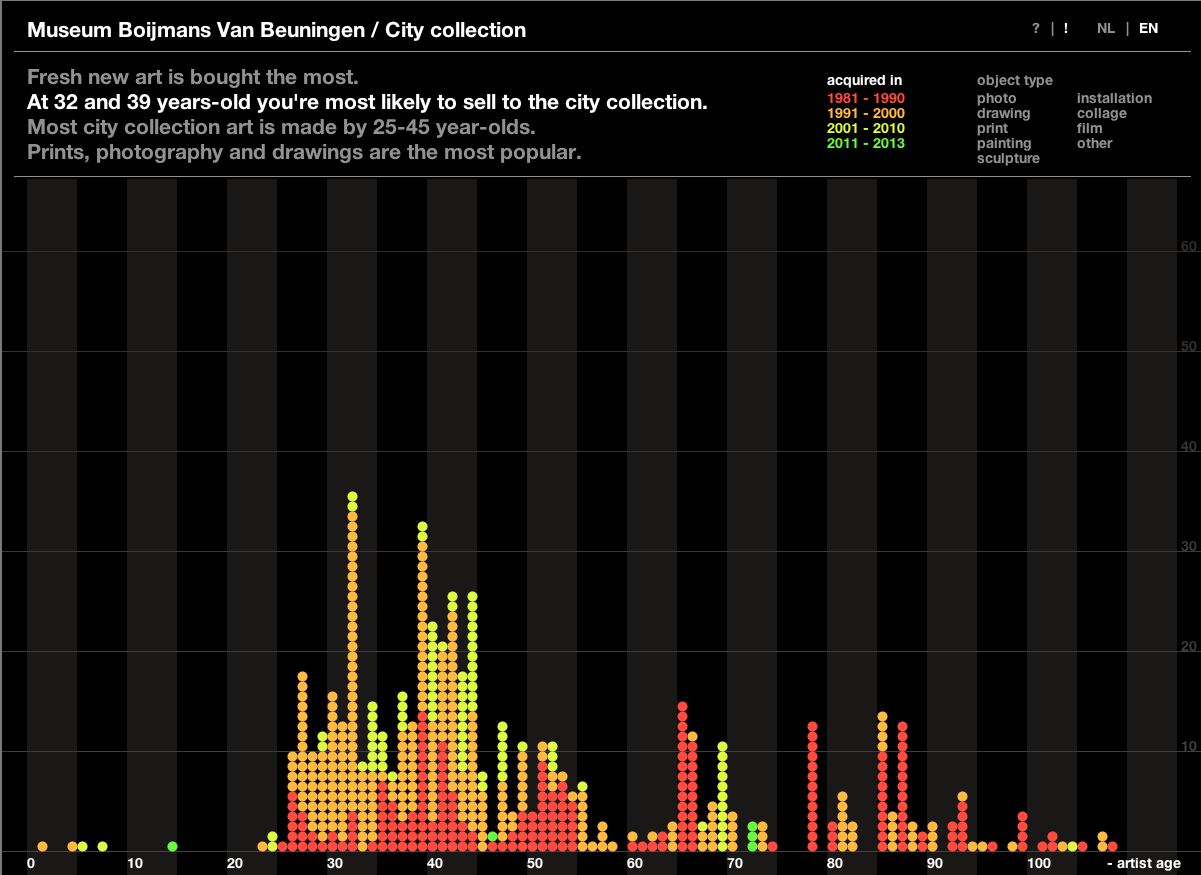
– how old was the artist when the artwork was bought?
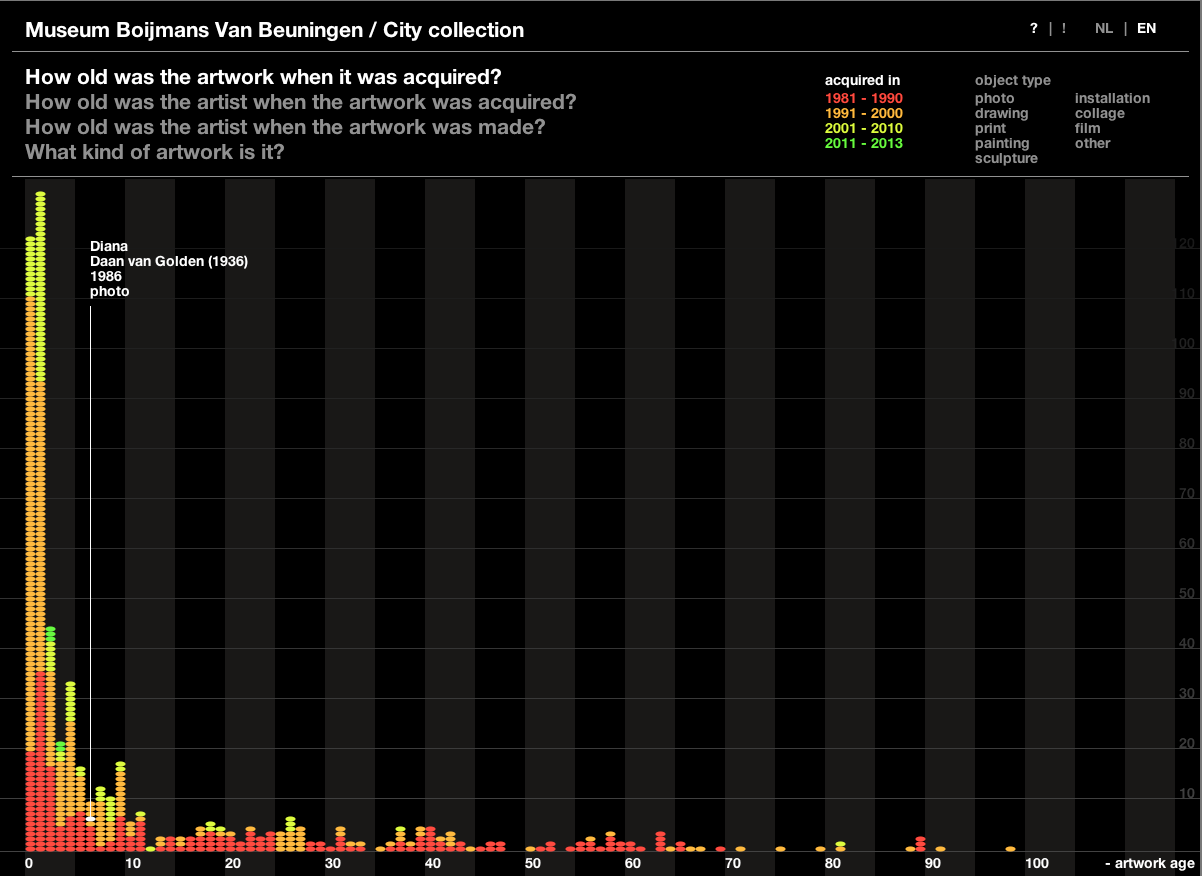
– or how old was the artwork when it was bought by the museum?
– what kind of artwork is it?
You can switch the colors to see which era the artwork was bought in, or what kind of work it is (photos, drawings, and prints are popular).
Mouseover the pixels to get the title, maker and year the artwork was made.
All of this with some pretty neat flying dots! – Enjoy.
// Update 16.01: Now available  in English for niet-Nederlanders..
// Update 18.01: Cleaned up, improved interface. Added statements, next to questions.
Download Mac / Windows / Linux